Atlanta Crimes
Atlanta Crimes
We have explored the trends in crime data for the city of Atlanta. We were interested to see the
relationship between crimes and neighborhoods through household income. We also be analyzed the types of crimes
happening and when they are most likely to occur. This topic is something that is relevant for all of us, and can
give us some insight on a topic that affects all of our daily lives. Our hypothesis was neighborhoods with
lower median home income see statistically significant higher crime rates. The data we obtained included over
26,000 data points that include, Time and date of crime, Specific charge , Street Address, Neighborhood
These are our findings:
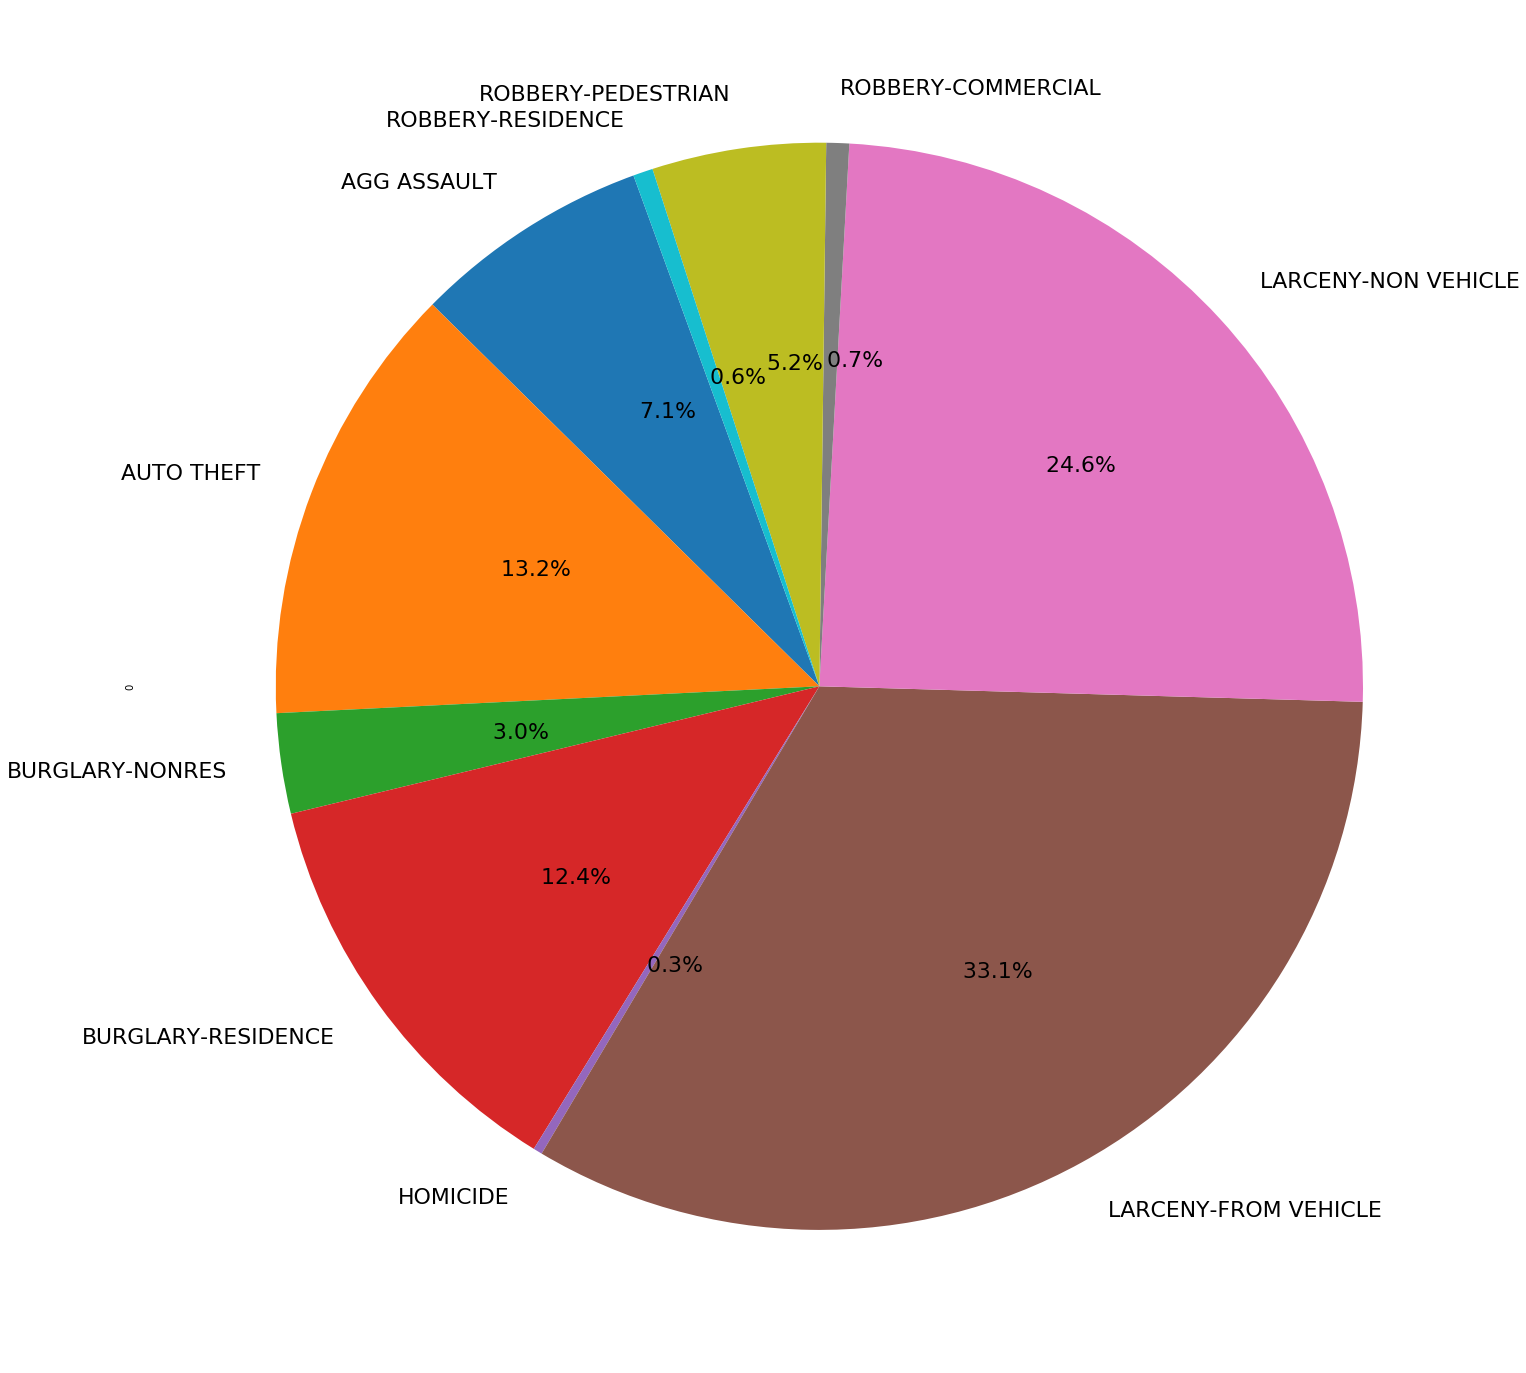
- The most common type of crime is Larceny From Vehicle, the least common is Homicide.
- The neighborhood with the highest median income was Paces (third lowest per-capita crime
rate), the neighborhood with the highest crime per-capita was Westend.
- The lowest crime rate per-capita was Georgia Tech, the next lowest was Knight Park / Howel Station.
- The most crimes happened in June followed by July, February was the least.
- The most crimes occurred on Friday, the least on Sunday.
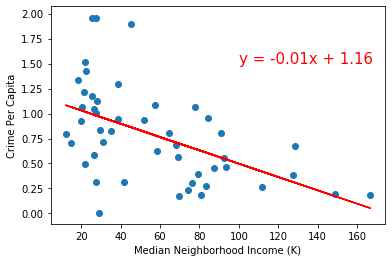
There is no linear relationship between income level and crimes per-capita in a given neighborhood.
The followings are the results from our linear regression:
P value = 0.00014
R value = -0.52307
With a P value < 0.05, we show that an increase in median income is correlated with a decrease in crimes
per-capita. Also, our R value shows that there is not a strong linear correlation between median
income level and crimes per-capita
Used: Python, Pandas, gmaps, numpy, scipy, JSONs and API's
Github : https://github.com/lumindak/Atlanta_crime-data-project